Venus en las Casas: Significado de un Venus Natal en la Casa Undécima

Urano Cuadratura Sol Tránsito
Parte de la Fortuna en Casa 7 Natal

Lilith en Casa 10
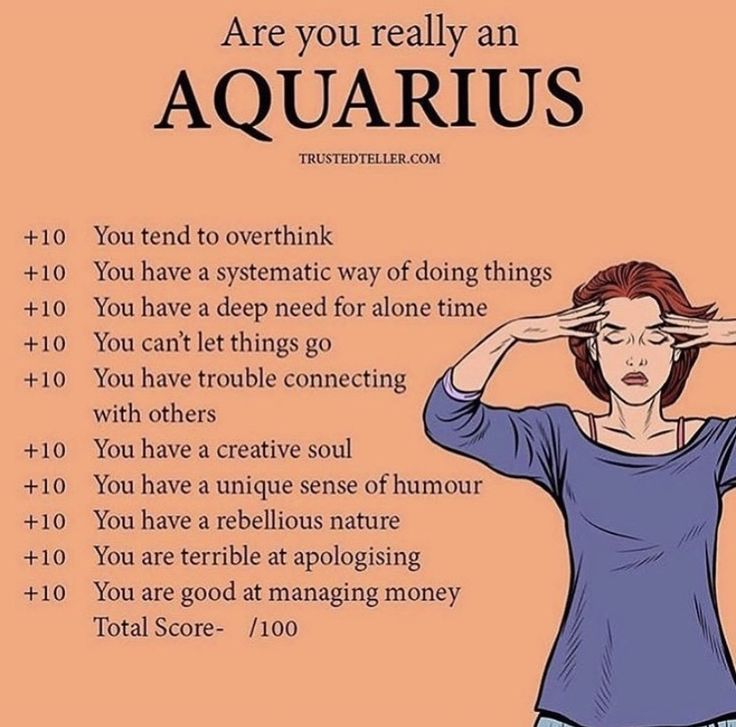
Datos del zodiaco: 10 cosas que un Acuario quiere que sepas pero nunca te dirá
Venus en Géminis Natal Significado
Mercurio en Virgo Significado en la Carta Natal
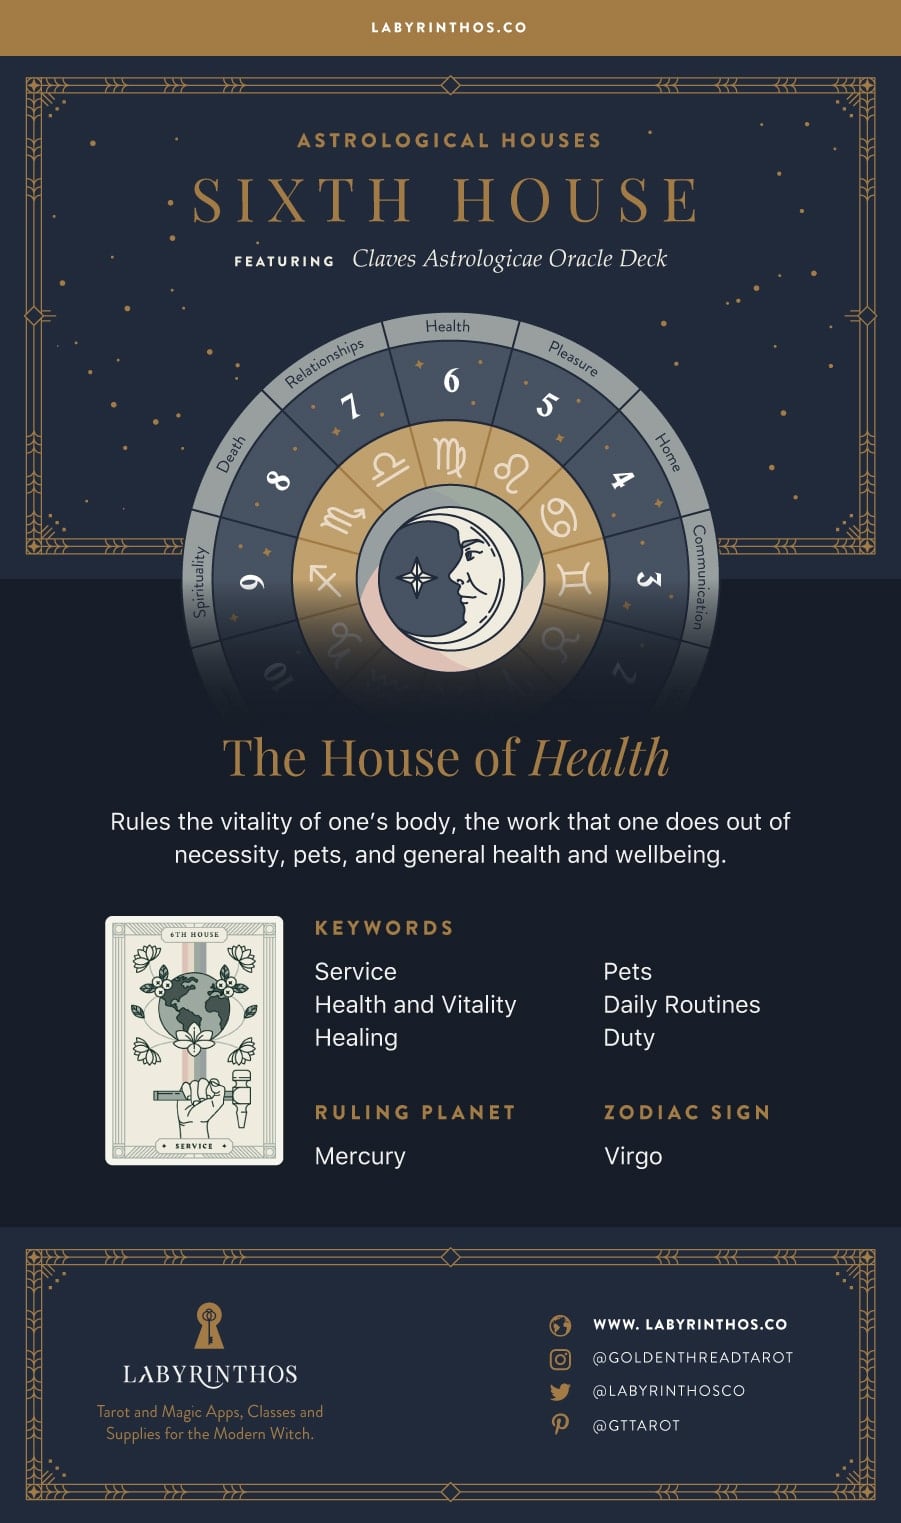
Mercurio en Casa Sexta Natal Significado en Astrología
Nodo Norte en Aries Natal Significado en Astrología
Luna Negra Lilith en Libra en la Carta Natal

Júpiter en Casa Quinta Natal Significado en Astrología
Mercurio en Segunda Casa Natal Significado en Astrología
Mercurio en Casa Ocho Natal Significado en Astrología